Local Standardized Mean Difference (LSD) Calculation
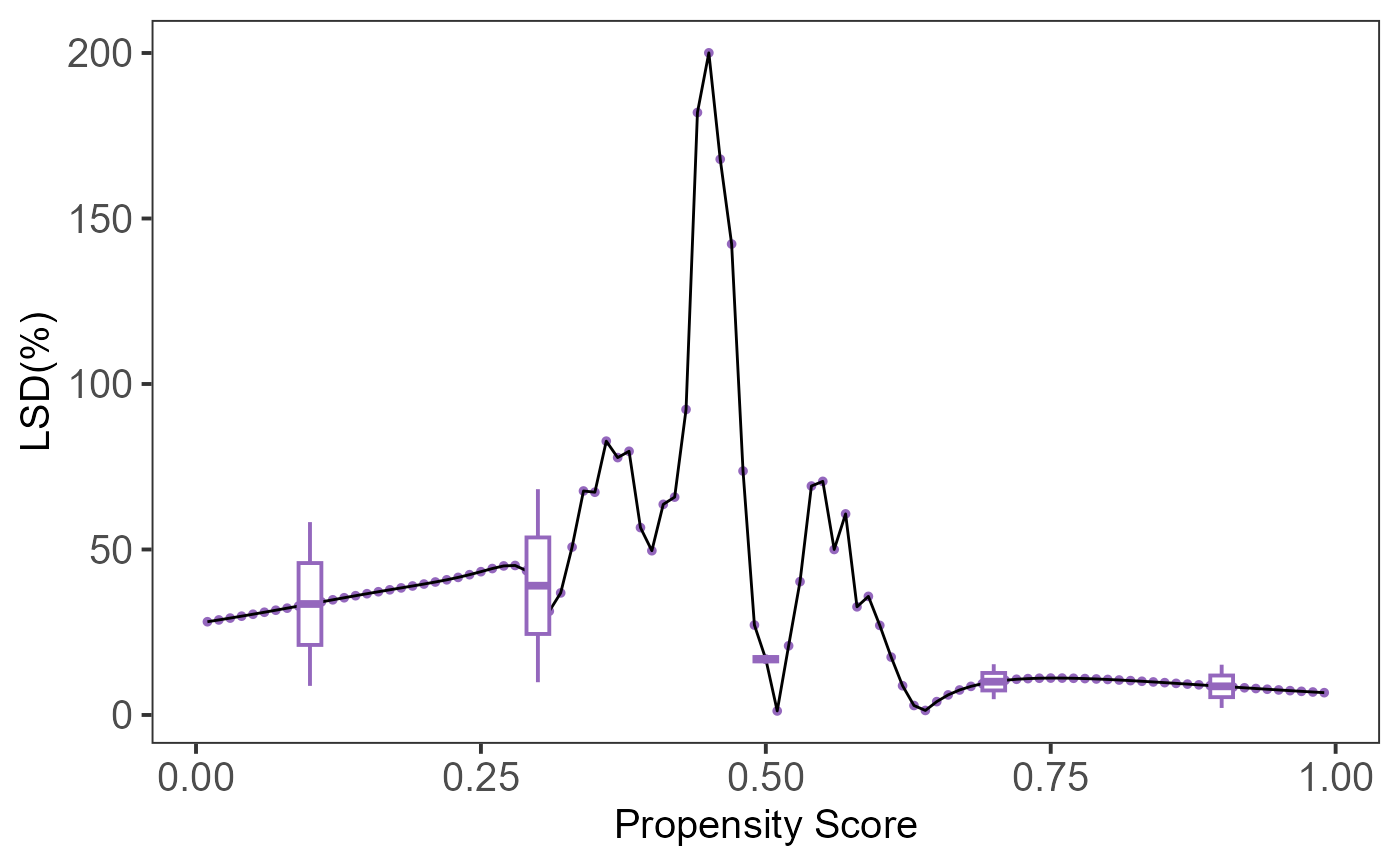
lsd.RdComputes the Local Standardized Mean Difference (LSD) for assessing local balance in causal inference. The LSD measures the standardized mean difference for covariates at pre-specified grid points `ck` using kernel-based local inverse probability weighting of propensity scores.
Usage
lsd(
  object = NULL,
  Z = NULL,
  Tr = NULL,
  ps = NULL,
  ck = NULL,
  h = NULL,
  K = 99,
  rho = 0.15,
  kernel = "gaussian",
  ate_flag = 1,
  ...
)
Arguments
- object
An optional object of class `lbc_net`. If provided, extracts `Z`, `Tr`, `ps`, `ck`, `h`, and `kernel`.
- Z
A matrix or data frame of covariates. Required if `object` is not provided.
- Tr
A binary vector indicating treatment assignment (1 for treatment, 0 for control). Required if `object` is not provided.
- ps
A vector of propensity scores. Required if `object` is not provided.
- ck
A numeric vector of pre-specified grid points for local balance assessment. If NULL, it is automatically calculated.
- h
A numeric vector of bandwidths. If NULL, it is automatically calculated.
- K
The number of grid points to use if `ck` is not provided. Default is 99.
- rho
A scaling parameter used in bandwidth calculation. Default is 0.15.
- kernel
The kernel function used. Options are "gaussian", "uniform", or "epanechnikov". Default is "gaussian".
- ate_flag
An integer (0 or 1) specifying the target estimand. The default is 1, which estimates the Average Treatment Effect (ATE) by weighting all observations equally. Setting it to 0 estimates the Average Treatment Effect on the Treated (ATT), where only treated units are fully weighted while control units are downweighted based on their propensity scores. See Details in
lbc_net.- ...
Additional arguments passed to the specific method.
Value
An object `lsd` containing LSD values (%) for each covariate, which includes:
`LSD`: A matrix of LSD values for each covariate at each `ck`.
`LSD_mean`: The mean absolute LSD value across all covariates.
`LSD_max`: The maximum absolute LSD value.
Other model components (e.g., `Z`, `Tr`) are accessible via `$`
or the recommended getLBC function. While direct access (e.g., `fit$fitted.values`)
is possible, using `getLBC(fit, "LSD")` is recommended for stability and future-proofing.
Details
See lbc_net for details for local kernel weights and arguments `ck`, `h`, `K`, `rho`, and `kernel`.
The formula for LSD follows the same structure as the Global Standardized Mean Difference (GSD) (gsd),
but the weights `W_i` are replaced with `W'_i`, Local Inverse Probability Weight (LIPW). LSD is expressed as a percentage in absolute value.
Like GSD, LSD can be used for assessing balance in covariates, but LSD is specific to propensity score-based methods.
Examples
# Example with manually provided inputs
set.seed(123)
Z <- matrix(rnorm(200), nrow = 100, ncol = 2)
Tr <- rbinom(100, 1, 0.5)
ps <- runif(100, 0.1, 0.9)  # Simulated propensity scores

# Compute LSD using manually provided inputs
lsd_result <- lsd(Z = Z, Tr = Tr, ps = ps, K = 99)
#> Calculating propensity scores for ck/h calculation...
print(lsd_result)
#> Sample Size: 100  | Treated: 46  | Control: 54
#> Estimand: ATE (Average Treatment Effect)
#>
#> --- Local Balance (LSD) % ---
#> Max LSD: 262.5544
#> Mean LSD: 35.2833
#>
#> Kernel: "gaussian"
#>
#> Use summary(object) for a full model summary.
summary(lsd_result)
#> Call:
#>  function (x, ...)  UseMethod("formula")
#> Sample Size: 100  | Number of Covariates: 2
#> Treated: 46  | Control: 54
#> Estimand: ATE (Average Treatment Effect)
#>
#> --- Local Balance (LSD) % ---
#> Max LSD:   262.5544
#> Mean LSD:  35.2833
#>
#> Covariates   LSD %
#> -------------
#> Z1   46.9875
#> Z2   23.5791
#>

# Compute and visualize LSD results
plot(lsd_result)


if (FALSE) { # \dontrun{
# Fit LBC-Net model
model <- lbc_net(data = data, formula = Tr ~ X1 + X2 + X3 + X4)

# Compute LSD from the fitted model for ATE.
lsd_fit <- lsd(model)
print(lsd_fit)
summary(lsd_result)

# Visualize LSD results
plot(lsd_fit)
} # }
if (FALSE) { # \dontrun{
# Fit LBC-Net model
model <- lbc_net(data = data, formula = Tr ~ X1 + X2 + X3 + X4)
# Compute LSD from the fitted model for ATE.
lsd_fit <- lsd(model)
print(lsd_fit)
summary(lsd_result)
# Visualize LSD results
plot(lsd_fit)
} # }